
What is RidingData?
Very generally said, a software solution to work with data from motorbikes on racetracks. Targets the needs of amateur and professional riders. Data from different logger manufacturers can be imported.
The following video provides you a short overview:
Video run time: 3 minutes
Content: Short presentation of RidingData
The massive number of features can be grouped into three areas:
Management
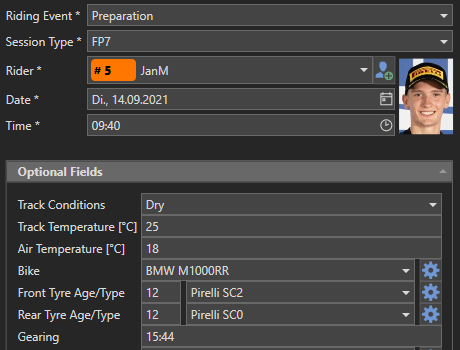
While importing data, multiple information can be assigned. Special setups, behavior tests and learnings can be documented in comment fields. By using this feature, you will always be aware of the specific situation.
Complete analysis situations can be saved as snapshots with comments. Restore is possible by just a mouse click.
Visualization
The values of channels for one or more laps will be shown in channel plots. 5 Plots can be configured and managed by plot templates.
Of course, the driven lines on the track are shown. The unrivaled GPS error correction algorithm results in unseen precise position visualizations.
Analysis
During data import, the data are automatically analyzed. RidingData determines characteristic values like maximum GPS speed, suspension average values, ideal lap times, sections times and so on.
Innovative and intuitive usable tools and views assist you when searching for ways to reach better lap times.
The heart of RidingData
The base approach of RidingData is to compare multiple laps, based on the GPS position. In our experience, this is the most reliable way to perform meaningful comparisons. No longer, apples and pies will be compared.
In the very early development phase, the focus was set on two elementary core concepts to reach the position-based comparison power. And we succeeded. Verified on a massive amount of data, we can proudly say, it works like a charm. Following, please find brief information regarding the two unique core features.

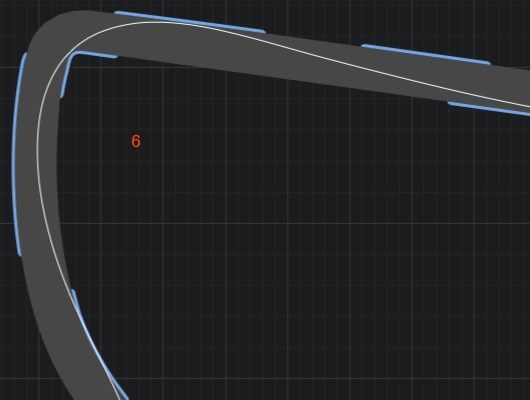
The advanced GPS improvement method analyses and corrects position data from the logger. It delivers impressive precise drawings of the driven line on the track and is the base for the position synchronization.

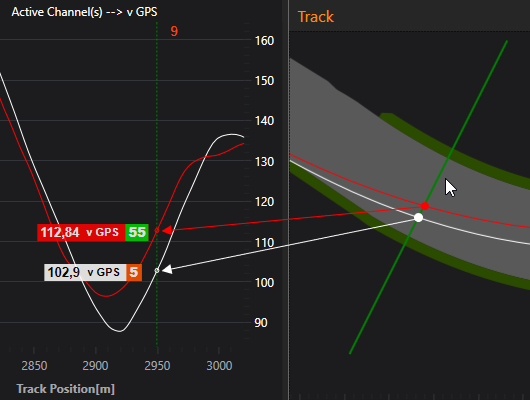
Resampling data to values at the same position is the task for the "Synchronization Engine" and therefore represents the elementary core function of RidingData.
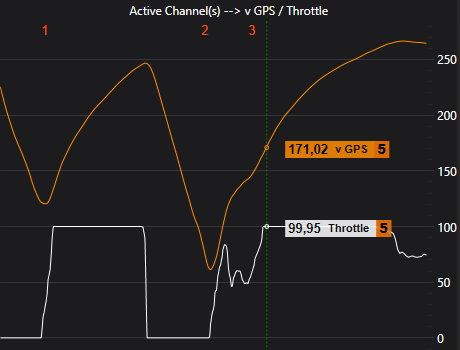
The graphic above shows the relation between the position on the track and the vertical cursor in the channel plots.
The possibilities which can be realized through this synchronization technique are game changing in race data comparisons.
Do you want to go faster?
RidingData is specialized regarding calculation and visualization of time differences when comparing multiple laps. The unique core methods allow showing the effect on time (time gaining, loosing) over the whole track.
The very base of systematic improvements in motor sports is to know, on which areas / topics the focus has to be set. This can be accomplished with a view mouse clicks when using RidingData. Innovative tools help you in the next step to find the root cause for the time differences.
After defining a new strategy and trying to implement it on the next ride, RidingData helps you to double-check the effect of your changes (setup, riding a different line,...).
The extended introduction video leads step by step through the workflow, using a real-world example. The following slides show some screenshots of topics, which help you to improve your lap time.
Time Difference
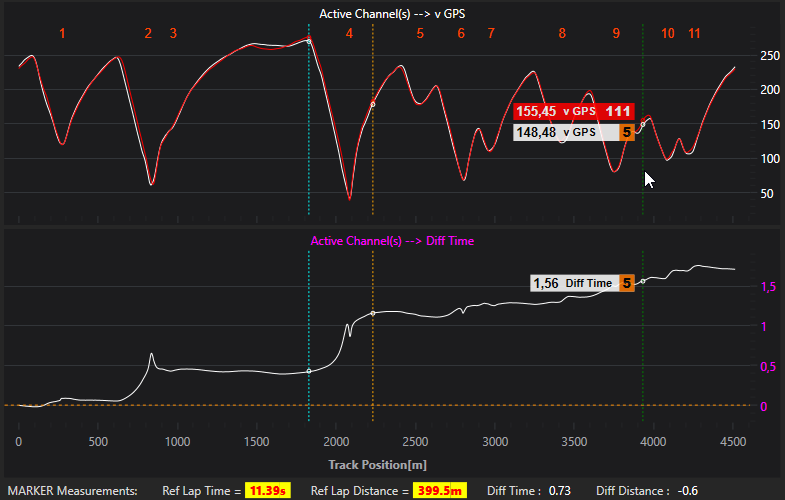
When two or more laps are selected, the plot "Diff Time" shows the development over the whole track.
The most important areas can be seen at first glance. There, the focus of improvement has to be set.
Marker measurements show information for the specific area between the movable markers.
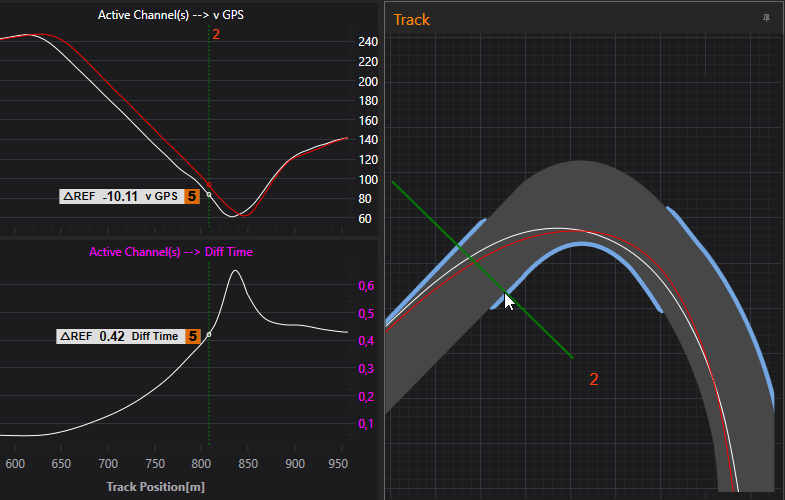
Cursor
The cursor position in the channel plots is always drawn as a line across the track. This works in both directions. If the mouse is placed or moved in the track plot, the cursor in the channel plots always show the data at this track position.

Lap Selection
The "Lap Selection" panel includes all imported data sets regarding the current track. Events are created automatically. By using the checkboxes you can set, which laps shall be shown in the plots.
The content of the rows can be configured. In the shown screenshot, maximum GPS speed (green colored) and suspension average data (blue colored) are activated.
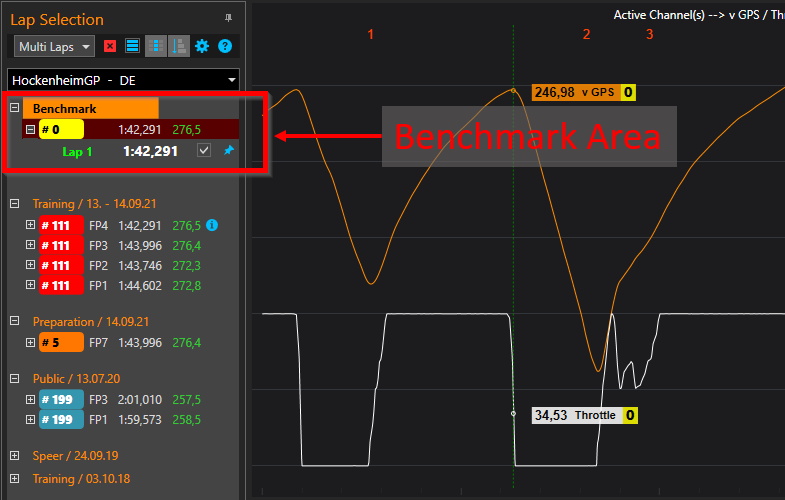
Benchmark
The comparison with data from a fast rider delivers important ideas of the potentials. It doesn't matter whether it is caused by the driven line or something else, the analysis tools will bring it out to you.
For many tracks, RidingData supplies you with so called 'Benchmark' data, which are laps from a very fast rider. Usually from the national Superbike championship.
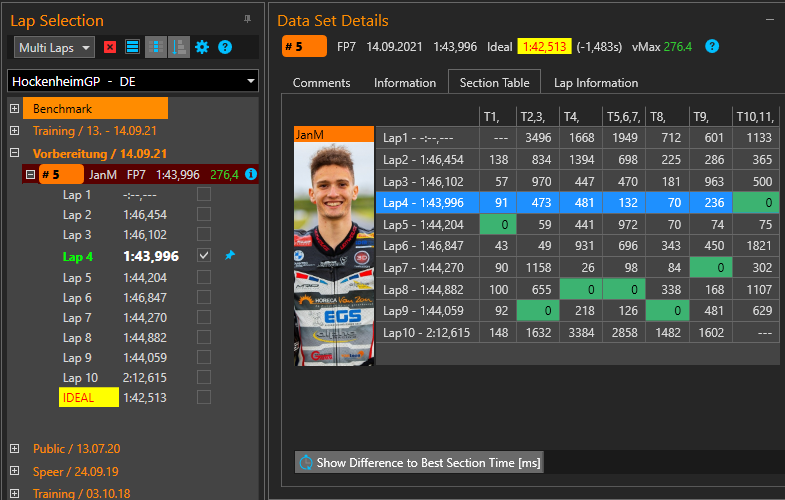
Sections
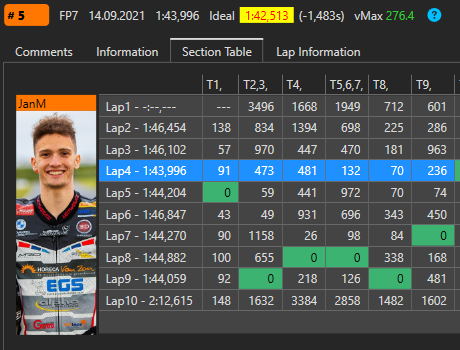
While importing data, each dataset is automatically analyzed regarding sections times. A table visualizes, in which laps the best section times could be performed.
By adding the best section times, the ideal lap time is calculated. Everyone knows, sometimes a slower rider damages your excellent lap time. With RidingData you know how fast it could have been.
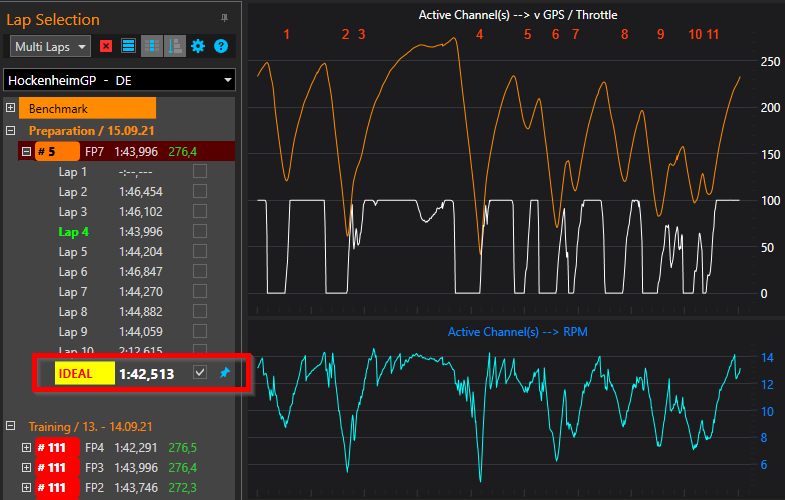
Ideal Lap
In the lap selection panel, the ideal lap can be found for each data set. This can, as any other regular lap, be used by the checkbox for comparisons.
The ideal lap is the sequence of the best sections in the data set.
Voices of the users

Jan Mohr
Working with RidingData was one of the most important tools regarding my development from an amateur to a pro rider.
No other racedata analysis software shows that precise and understandable where I gain or lose time on the track.


")
")